🗺️ Live isochrone travel map
🚉 On Trains: Post #7
Introduction
This short post introduces a new live visualisation that can be found here, and explains the origin of the data.

What is this?
It's been a while since I last published a blogpost about my research on trains. If you've been following my blog in the past months, you will know about my interest for isochrone maps.
The visualisation you see above is - well - not quite an isochrone map. It does not show isochrones (areas that can be reached within the same time), but instead it plots every data point with a different colour. The number of data points make it resemble an isochrone map for most western-European stations, especially when zoomed out.
So, where does the data come from? Stations in the map comes from the Trainline stations dataset, and are coloured depending on the time it takes from different starting stations (European capitals). The time was calculated with 4 different modes, which can be selected in the interface:
- Theoretical Train Infrastructure Time
- Actual Train Time
- Theoretical Car Time
- Flight Time
Let me now tell how these modes were computed.
Theoretical Train Infrastructure Time
This uses a custom LUA profile with the Open Source Routing Machine (OSRM), which tells the router to use rail tracks instead of roads, and sets the appropriate limits (speed, direction, ...). As was described in my last post, a similar tool can be used on signal.eu.org/osm/.
The resulting time should indicate the theoretical limit of the rail network, meaning: "if I had my own private train, without other trains on the network, and could go anywhere without having to stop, how long would it take me to reach [x]?". This metric is useful to:
- see limitations in the current network infrastructure
- seeing where the infrastructure is under utilised, by comparing it with the "Actual Train Time"
The script to compute all times took less than 2 hours to run, and returned 451218 unique connection pairs.
Actual Train Time
This reports the fastest trip time using MOTIS with collected GTFS data of rail travel in Europe, leaving Friday, March 21st 2025 at 5am, adjusting the timezone based on the starting station, and with a 18h window.
The choice of the date is simply because it was the data I had at hand. Results are of course limited to the availability of the data. If, compared to the theoretical train infrastructure time, the value is missing or severely underperforming, this could be due to:
- lack of data
- lack of good connections
It is no secret that the quality of the data is not satisfactory for good results. This remains a good proof-of-concept, and can further help identify spots where data lacks.
The script took almost 3 days to run, and returned 264589 unique connection pairs.
Theoretical Car Time
Much like the Theoretical Train Infrastructure Time, this queries a default OSRM config with the starting and end station. It is important to note that the returned time should be treated as a lowerbound, as it does not take into account factors like traffic, road works and breaks.
The script returned 182708 unique connection pairs.
Flight Time
Data about flights was queried from FlightStats for the 11th of March 2025. The open source repository OpenFlights was used to retrieve a list of stations. Again, the date used was simply the date the script was run.
The following airports outside of the EU were removed: TUN (Tunisia), AYT (Turkey), IST (Turkey), SAW (Turkey), TNG (Morocco), AHU (Morocco), FAE (Faroe Islands).
To make the comparison fair, I have added 2h to each data point, which I consider a fair lowerbound for getting to the airport + going through security + getting out of the airport.
The script returned 372 unique connection pairs.
Some more plots
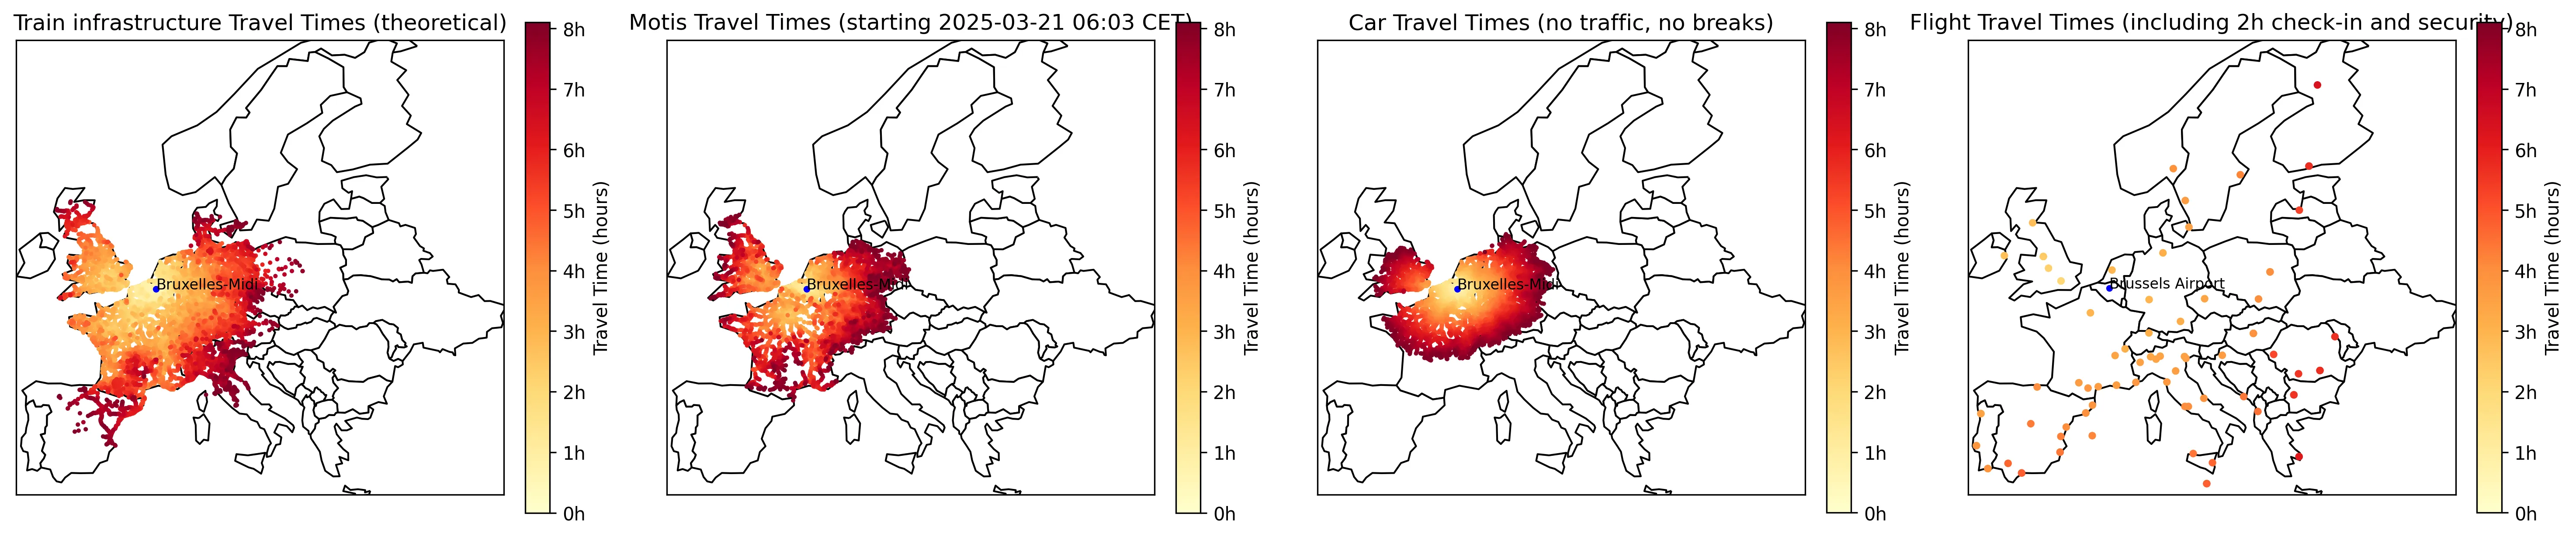
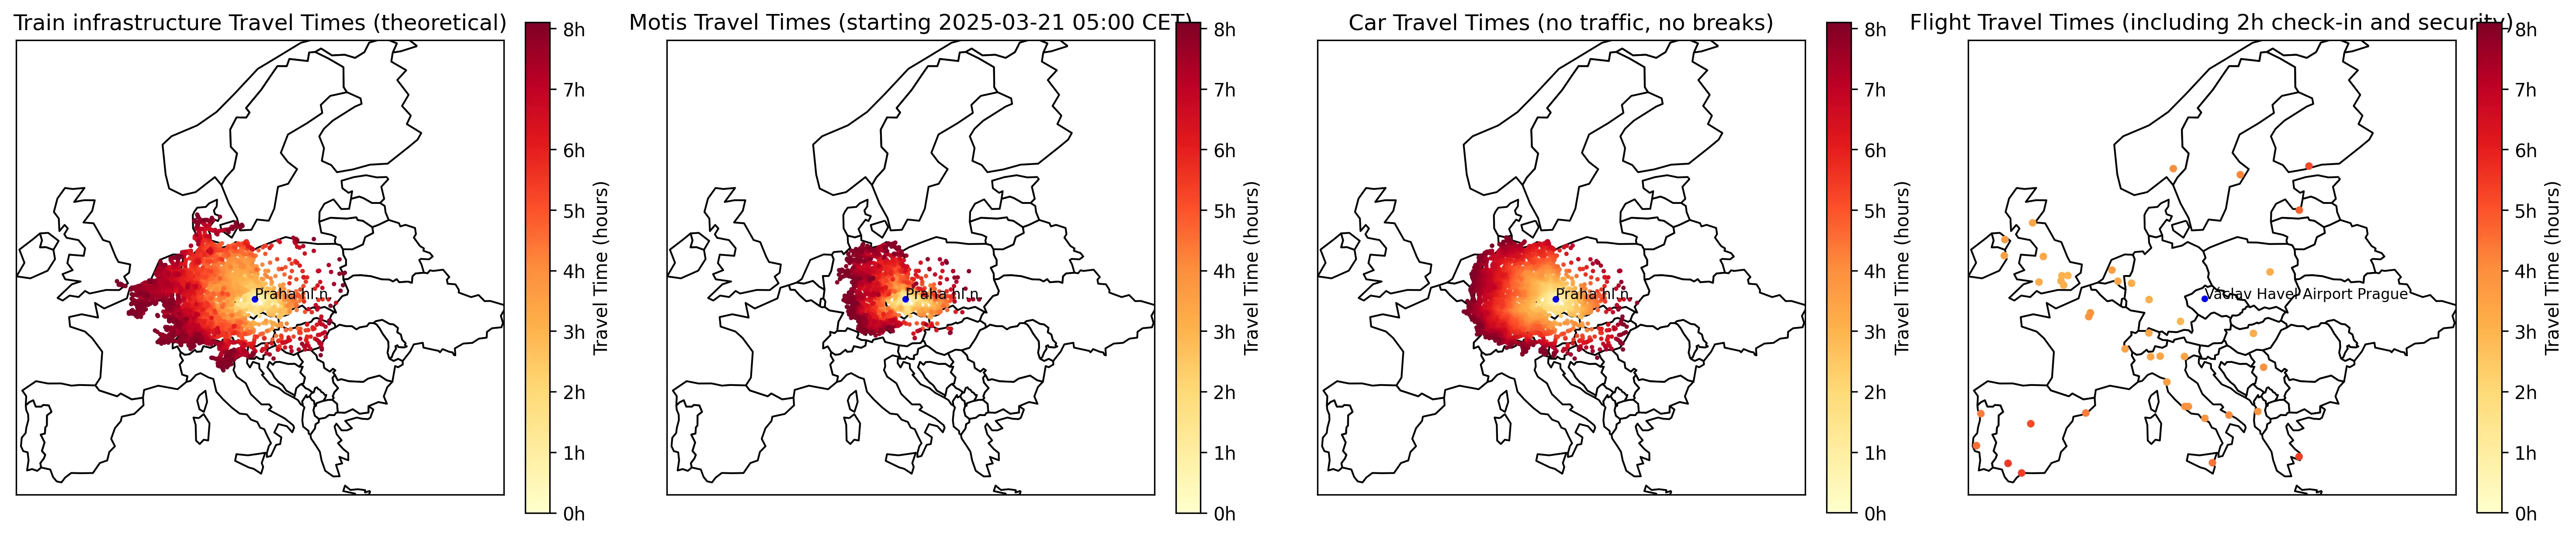
If you're interested in a side-by-side comparison for two cities (Brussels and Prague) here it is!
Bruxelles-Midi:
Praha hl. n.
Closing thoughts
I've taken a break from writing regular blogposts updating about my work, as results were unsatisfactory. I am now in the process of writing my master thesis, after which I might come back with more updates (who knows! ) :).
I do not intend to update the map with real-time data, as the process takes too long to run. For up-to-date isochrone maps, you can use Chronotrains.com.
If you're particularly interested about an analysis of the above map, feel free to send me a message.
Note: no text in this document has been generated or rewritten by a Large Language Model.